A practical guide to R6 statistics from Siege Tracker. Learn what rank, Rank Points, K/D ratio, win rate, headshot % and match volume really measure, how seasonal and lifetime stats differ, and how to read any player profile with confidence.
Core R6 Stats at a Glance
The four headline numbers behind Ranked 3.0, the current ranked system as described by Ubisoft.
Where your numbers come from matters as much as the numbers themselves. Here is how time range and sample size change the picture.
Seasonal vs Lifetime
Lifetime stats add up every match on your Ubisoft Connect account, sometimes across many years. Seasonal stats cover only the current season, which starts with a rank reset. A lifetime K/D of 1.10 can hide a current season at 0.90, or the reverse, because hundreds of older matches dominate the average and barely move once they are banked.
Use seasonal numbers to judge current form and rank progression, and lifetime numbers to understand your long-term baseline. When you compare two player profiles, make sure you compare the same range: seasonal against seasonal, ranked against ranked. Mixing casual, unranked and ranked data on PC, PlayStation or Xbox gives a misleading result.
Seasonal stats also explain rank. Ranked 3.0 has no hidden MMR: matchmaking uses Rank Points only, and each result moves your RP based on the outcome and the rank balance of both teams. That is why two players with similar K/D can finish a season in different ranks: win rate, consistency and match volume all feed the outcome.
Match Volume & Sample Size
Match volume is simply how many matches sit behind a stat. It is the first thing to check on any profile, because small samples swing wildly. Example: a player at 6 wins and 4 losses shows a 60% win rate, but one more loss drops it to roughly 55%. At 120 wins and 80 losses, the same single loss barely moves the number.
As a rule of thumb, treat fewer than about 50 matches as an early read rather than a verdict, and give more weight to stats built on a full season. This applies to K/D, win rate, headshot % and especially operator stats and map stats, where the match count for any single operator or map is usually much smaller than your overall total.
Volume also shapes leaderboards and rank distribution. Players who grind many matches have more stable numbers and more chances to climb, while a low-volume account with a high win rate may simply not have met tougher opponents yet. Always read the match count before you compare player stats or judge a sudden jump.
R6 Stat Categories
What each core Rainbow Six Siege statistic measures, how it is calculated, its break-even point and how many matches it needs.
Kills divided by deaths. A K/D of 1.0 means you break even in duels; higher means you win more duels than you lose. It measures gunfight results, not round impact, so always read it alongside win rate and the role you play.
Wins divided by wins plus losses, multiplied by 100. Win rate is the stat most closely tied to rank, because Rank Points follow match results. A rate that holds above 50% across a full season usually means your rank is still climbing.
Headshot kills divided by total kills, times 100. It reflects crosshair placement and weapon choice more than overall skill. Shotgun and support players often show lower numbers, so compare it within the same role and loadout.
Ranks run from Copper through Bronze, Silver, Gold, Platinum, Emerald and Diamond to Champion, and every tier, Champion included, has divisions V to I. RP moves after each ranked match with the result and the rank balance of both teams.
Total kills divided by matches played. Unlike K/D, it ignores deaths, so it shows raw output per game. A high figure with a low K/D usually means an aggressive style that takes many fights and loses a fair share of them.
Ranked 3.0 removed hidden MMR, so matchmaking uses Rank Points only. Squads can span up to 3 full ranks from Copper to Emerald, or 2 in Diamond and Champion. RP gains are larger when you beat stronger teams.
No MMR
Hidden Rating
RP Only
Matchmaking Basis
3 / 2
Squad Rank Gap
R6 Stat Formulas & Rules
The formulas and rules of thumb behind the numbers on any Rainbow Six Siege player profile.
W ÷ (W+L)
Win Rate Calculation
Wins ÷ (wins + losses) × 100. Count only completed matches and compare the same queue.
HS ÷ K
Headshot Percentage Formula
Headshot kills ÷ total kills × 100. Read it next to K/D, never on its own.
50+ games
Minimum Useful Sample
Guidance: treat fewer than about 50 matches as an early read; streaks distort short runs.
K ÷ M
Kills per Match Formula
Total kills ÷ matches played. Useful for comparing output between players with very different match counts.
Reading R6 statistics well takes more than knowing the formulas. This section covers the statistical thinking behind good conclusions, including variance, averages and medians, regression to the mean, confidence ranges, fair player comparisons, charts and leaderboards, seasonal resets and platform splits.
None of it needs advanced maths. Each idea comes with a plain worked example you can apply to your own Rainbow Six Siege statistics.
In this guide
Why R6 Statistics Swing So Much
Every match of Siege has a lot of randomness built in. Teammates change, opponents change, maps rotate and a single round can turn on one peek. That randomness is called variance, and it is the main reason R6 statistics jump around from week to week.
Variance means streaks are normal. A run of five losses does not prove you got worse, and a run of five wins does not prove you got better. Both can happen to a player whose real level has not changed at all.
The practical lesson is to judge trends, not moments. Look at how a number moves across several checkpoints of similar size before deciding anything. The more matches sit behind a stat, the less any single streak can push it around, which is why sample size always comes first.
Averages vs Medians in Siege Statistics
An average, or mean, adds everything up and divides by the count. A median is the middle value when you line results up in order. In Siege statistics, the two can tell very different stories.
Take a worked example of kills across five matches, with values 3, 4, 4, 5 and 19. The average is 35 ÷ 5 = 7 kills per match, but the median is 4. One huge game pulled the average up, while the median shows what a typical match looked like.
When you review your own R6 statistics match by match, check both. If your average is far above your median, a few standout games are flattering the number. If they are close, your performance is consistent. Most profiles only show averages, so a quick median check from your own notes adds real insight.
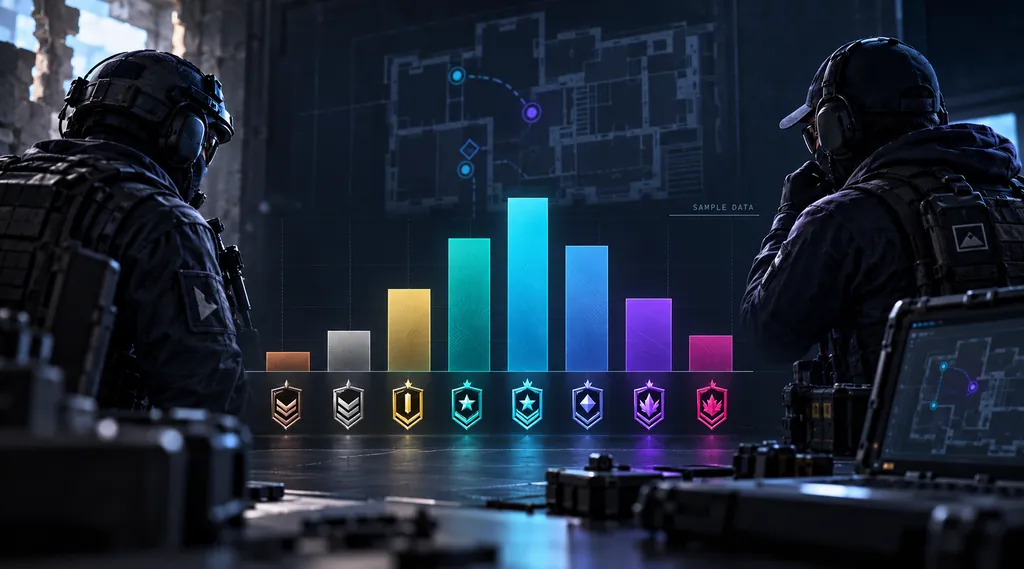
A distribution shows the spread of results, not just one average.
Combining Seasons Without Breaking the Maths
A common mistake when combining R6 statistics is averaging ratios. If you want a combined K/D across two seasons, add up the raw totals first, then divide. Never average the two K/D values.
Here is a worked example. In one season you had 100 kills and 50 deaths, a K/D of 2.00, over a few matches. In the next you had 300 kills and 300 deaths, a K/D of 1.00. Averaging the ratios gives 1.50. The correct combined figure is 400 ÷ 350 = 1.14.
The small season dominated the simple average even though it held far fewer matches. The same rule applies to win rate and headshot %. Keep totals, recalculate ratios from those totals, and your combined Rainbow Six Siege statistics will always reflect how much you actually played in each period.
Reading Rank Distribution Charts
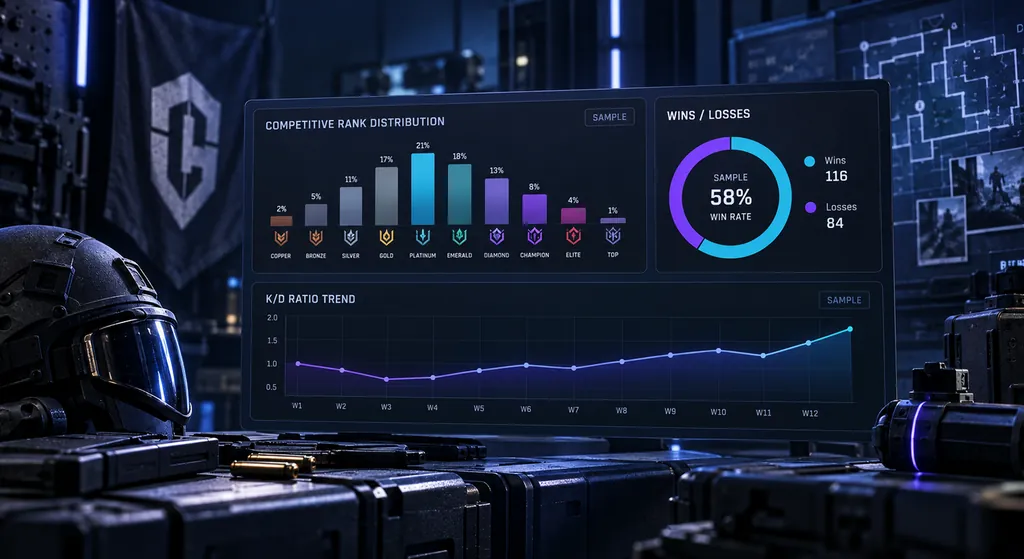
A rank distribution chart shows how players are spread across tiers from Copper up to Champion. It answers where most players sit, not how good any single player is.
Read three things before trusting one. First, check the source. Third-party charts usually reflect only accounts that site has looked up, which may lean towards more active or more competitive players. Second, check the date. Early in a season, ranks have just reset and many players have not played enough to settle, so the shape changes as the season goes on. Third, check the platform, because separate competitive environments can produce different shapes.
Treat any distribution as an approximate snapshot of R6 statistics, not an official census. For more on what these charts can and cannot show, read the R6 rank distribution guide.
Rank distribution charts are snapshots that shift as each season goes on.
Regression to the Mean in R6 Statistics
Regression to the mean is one of the most useful ideas in R6 statistics. Extreme results over a short run tend to be followed by results closer to your normal level, simply because part of the extreme came from luck.
As a worked example, say you start a season 6 wins and 2 losses, a 75% win rate. Over the next few dozen matches, it is likely to drift back towards your usual level. That does not mean you got worse. The early number was partly a lucky streak.
It works in the other direction too. A terrible first week usually recovers without any big change on your part. Keep this in mind before changing your sensitivity, operators or role after a short streak, and before praising or blaming a new habit too early.
How Confident Can You Be in R6 Statistics
Every stat has a margin of uncertainty, and that margin shrinks as the sample grows. Thinking in ranges instead of single numbers is how analysts read R6 statistics honestly.
Here is a worked example using standard statistical maths. If your true chance of winning a match were 50%, then over 100 matches your observed win rate could quite easily land anywhere from roughly 40% to 60% just from chance. Over 400 matches, that range narrows to roughly 45% to 55%.
So a 54% win rate over 100 matches is encouraging but not proof that you are above even. The same 54% over several hundred matches is much more convincing. Use this idea whenever you compare two Rainbow Six Siege statistics that are close together, especially for operator stats and map stats, where each sample is smaller.
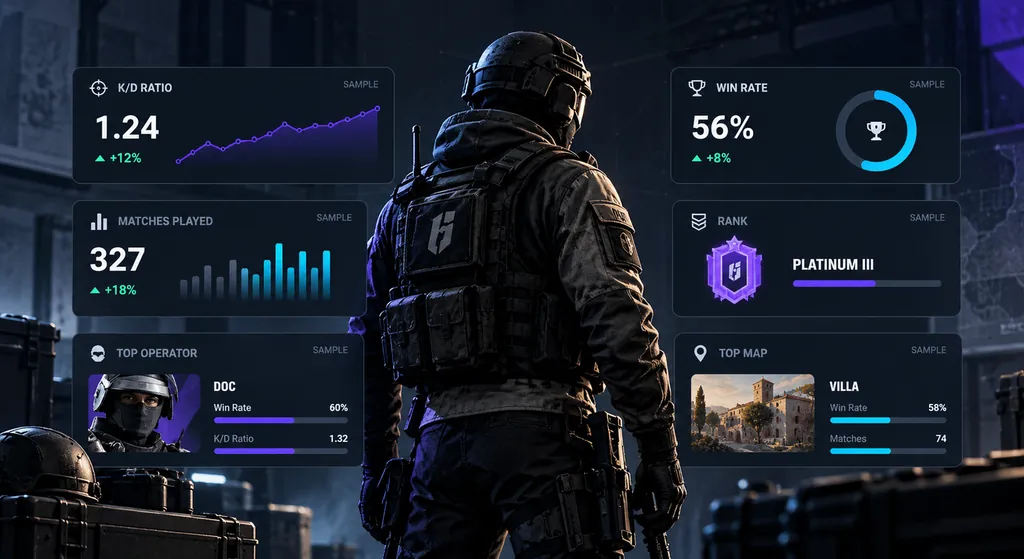
Read every metric tile alongside the sample size behind it.
Comparing Players Fairly
Comparing two players and their R6 statistics only works when their numbers come from the same conditions. Before you decide who is stronger, line up these factors.
Same mode. Ranked against ranked, never ranked against casual.
Same time range. Seasonal against seasonal, lifetime against lifetime.
Same platform. PC and console environments differ in input and opponents.
Similar rank. A K/D earned in higher lobbies is harder to achieve.
Similar volume. A short record is far less reliable than a long one.
Same role. Entry and support players produce different stat lines by design.
If two stat lines fail any of these checks, note the difference before drawing conclusions. To put two players side by side with identical formulas, enter both sets of numbers into the K/D & Win Rate Calculator.
Reading Charts and Leaderboards Without Being Misled
Charts make Siege statistics easier to scan, but they can also mislead. Check the vertical axis first. If it starts well above zero, a small change can look like a dramatic rise or fall. Then check the time window, because a chart covering two weeks tells a different story from one covering a full season.
Leaderboards need similar care. A board sorted by a ratio, such as K/D or win rate, can favour accounts with very few matches unless the site sets a minimum match requirement. Always check how a leaderboard filters players, which platform and season it covers, and whether it ranks by RP or by another stat. Treat R6 statistics on any leaderboard as a filtered view, not a full ranking of every player.
The R6 leaderboards page explains how to read rankings fairly and what each column usually means.
Patterns across many matches matter more than any single hot spot.
Seasonal Resets and Platform Splits
Ranks reset every season, so the start of a season is the noisiest time for R6 statistics. Strong players start low and climb quickly, which means early-season lobbies can be very mixed. Early numbers swing more than late ones, so give them less weight.
Big game updates can matter too. Siege X launched in 2025, and changes like that can shift how matches play. It is reasonable to compare your form before and after a major update separately rather than blending everything together.
Platforms add another layer. Depending on the season and how your account is set up, progress may be shared or separate across PC, PlayStation and Xbox. Label every number with its platform and season. The R6 seasonal stats guide covers season-by-season tracking in more detail.
Correlation, Causation and Selection Bias
Two numbers moving together does not mean one causes the other. If your win rate rose in the same month you switched operators, the operator might be the reason, or you might simply have played more with a regular squad. Check what else changed before giving credit.
Selection bias is just as common. Clips, forum posts and shared profiles tend to show standout performances, not typical ones. Stat sites can also only show accounts that have been looked up. Any picture built from that data leans towards the players who appear most, not the whole player base. Keep that in mind whenever R6 statistics are used to make claims about everyone.
The fix is to ask where the data came from and what might be missing. Our data accuracy page explains why figures often differ between sources and why Siege Tracker never claims live data.
How to Avoid Misreading R6 Statistics
Use this checklist each time you read R6 statistics, whether they are yours or someone else’s.
Check the match count before any ratio.
Confirm the mode, season and platform.
Rebuild ratios from raw totals rather than averaging them.
Expect extreme early numbers to drift back towards normal.
Think in ranges, especially for small samples.
Compare only like with like, including role and rank.
Ask what else changed before crediting a single cause.
To apply it, enter your own totals into the Stat Analyzer and read the results with these steps in mind. If your in-game numbers look wrong or missing, Ubisoft Help is the right place to ask. For metric definitions, see the R6 stats guide. Follow these steps consistently and your R6 statistics become a reliable guide to your play rather than a source of guesswork.
Analyze Your Own R6 Stats
Put these Rainbow Six Siege statistics to work. Enter your own numbers in the Siege Tracker Stat Analyzer. Nothing is stored, and we will never ask for your password.